
Sunday, August 11, 2013
Digital Sketching with PanelingTools
The following is a recording of part of an invited lecture at Savannah College of Art and Design (Feb 2012). It covers the use of PanelingTools as a tool to sketch paneling patterns.
Thursday, August 8, 2013
Parametric Curves - Basic Concepts
This article explains few basic concepts related to parametric curves using Rhino 5 and Grasshopper 0.9.
CURVE PARAMETER
Parametric curves are defined using a parameter. Think of a parametric curve as a path traveled between two points. If traveling takes T amount of time, then the parameter "t" represents any point in time within T, where the traveler will be at some point within the path.
For example, the parametric line equation is defined as:
P = P0 + t*v
where
P: is any point on the line
P0: is a given point on the line
t: is a parameter on the line, and
v: is a vector and represents the direction of the line.
Now suppose we have a straight path (linear curve) between the two points A and B, and v was a vector from A to B (v=B-A). We can use the parametric line equation to find all points "M" between A and B using the parametric line equation above:
M = A + t*(B-A)
where
t: is any value between 0 and 1

The range of "t" values, which are 0 to 1 in this case, is referred to as the curve "domain" or "interval". If "t" was a value outside the domain (less that 0 or more than 1 in this case), then the resulting point M will be outside the linear curve AB.
CURVE DOMAIN:
A curve domain is defined as the range of parameters that evaluate into a point within that curve. The domain is usually described as two real numbers (min to max) or (min,max). The domain limits can be any two values that may or may not be related to the curve actual length. However, it is very common that the domain be set to (0 to 1).
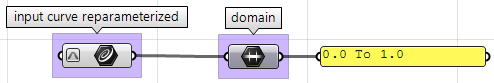
 Changing a curve domain is referred to as "reparameterize" the curve. In Grasshopper, you can set the curve domain to (0 to 1) using the "Reparameterize" option on any curve input. Also there is a Rhino command "Reparamterize" that allows you to set any min and max domain values. The following example in GH reparameterize the above curve domain to be (0-1):
An increasing domain means that the minimum value of the domain points to the start of the curve. Domains are typically increasing, but not always.
EVALUATE A CURVE
Evaluating a curve at a parameter that is within the curve domain results in a point that is "on" the curve. The following example curve has a domain (0 to 1). It shows how to evaluate the curve at mid-domain parameter (t = 0.5). Notice that parameter value that is in the middle of the domain might not evaluate into the middle point along the curve.
 That brings us to the concept of parameter density of a parametric curve. Using the traveling metaphor used above, you can think of uniform parameter density of a curve as traveling a path with constant speed. It is though possible (and more likely) that the speed decreases or increases along the path. For example, if it takes 30 minutes to travel a road, it is unlikely that you will be exactly half way through at minute 15. However, there are times when you need to evaluate points on a curve that are at a defined percentage of the curve length. For example, you might need the mid point of a curve. In order to achieve that, you need to find the parameter "t" at mid point and then evaluate the curve at that parameter. This parameter is called "normalized parameter". The following example evaluates a normalized mid domain parameter (t=0.5) for a curve that has domain (0 to 1).

TANGENT VECTOR TO A CURVE
A tangent to a smooth curve at any parameter (or point) is the vector that touches the curve at that point, but does not cross over. The slope of the tangent vector equals the slope of the curve at the same point. The following example evaluate the tangent at the two points defined in the above two examples.

CURVE PARAMETER
Parametric curves are defined using a parameter. Think of a parametric curve as a path traveled between two points. If traveling takes T amount of time, then the parameter "t" represents any point in time within T, where the traveler will be at some point within the path.
For example, the parametric line equation is defined as:
P = P0 + t*v
where
P: is any point on the line
P0: is a given point on the line
t: is a parameter on the line, and
v: is a vector and represents the direction of the line.
Now suppose we have a straight path (linear curve) between the two points A and B, and v was a vector from A to B (v=B-A). We can use the parametric line equation to find all points "M" between A and B using the parametric line equation above:
M = A + t*(B-A)
where
t: is any value between 0 and 1
The range of "t" values, which are 0 to 1 in this case, is referred to as the curve "domain" or "interval". If "t" was a value outside the domain (less that 0 or more than 1 in this case), then the resulting point M will be outside the linear curve AB.
CURVE DOMAIN:
A curve domain is defined as the range of parameters that evaluate into a point within that curve. The domain is usually described as two real numbers (min to max) or (min,max). The domain limits can be any two values that may or may not be related to the curve actual length. However, it is very common that the domain be set to (0 to 1).
An increasing domain means that the minimum value of the domain points to the start of the curve. Domains are typically increasing, but not always.
EVALUATE A CURVE
Evaluating a curve at a parameter that is within the curve domain results in a point that is "on" the curve. The following example curve has a domain (0 to 1). It shows how to evaluate the curve at mid-domain parameter (t = 0.5). Notice that parameter value that is in the middle of the domain might not evaluate into the middle point along the curve.
TANGENT VECTOR TO A CURVE
A tangent to a smooth curve at any parameter (or point) is the vector that touches the curve at that point, but does not cross over. The slope of the tangent vector equals the slope of the curve at the same point. The following example evaluate the tangent at the two points defined in the above two examples.
Saturday, August 3, 2013
Vector Display Tutorial
The first exercise was to create a vector that points to the positive "Y" direction and has a length equal to "5" units.
Knowing a vector is a direction and magnitude we need to start in a point defined in space, for this example we will use point (0,0,0)
Now to get point (0,0,0) We need to define that point in grasshopper, so we use either a panel [command: panel] or a number slider [command: type in any number]
We will define these sliders as 0 to get the coordinate (0,0,0), label X, Y, and Z to keep the definition readable for when the definition gets larger and you need to reference back to this point for easier access.

Next we create a vector with three input points X,Y,Z
To do this we need to create our own vector, and this is simple because we already have the anchor point to the vector. Now we just need to actually define the vector based off those coordinates. to do this we need the vectorXYZ component This can be found under; top menu bar, Vector --> Vector --> VectorXYZ or [Command: Vector XYZ]

Input:
XYZ
Output:
V: Vector
L: Length
We now have a vector point but no magnitude and at this point should not be visible in the rhino screen, this is normal.
To display this vector point we need a vector display, to do this we need the vector display component
to get this component go to; top menu bar, Vector --> Vector --> Vector Display or [Command: Vector Display]

Input:
A: Anchor
V: Vector
To view your anchor point plug in your Vec: V to VDis: A

Your point should now be visible
Next we have to create a magnitude and direction for this vector anchor point
To do this copy and paste your number sliders and Vector XYZ components, then take the output of the Vec: V and and plug this into the input VDis:V
You should now have a Vector with a magnitude in the X,Y,Z coordinates, to change this vector, you can now move any of the sliders to now have a changing vector which is an integral part in parametric design within grasshopper
Below are two examples of different vector configurations, to get multiple vectors copy and paste the whole single definition.


Subscribe to:
Posts (Atom)